Beamship Spectrogram Comparison
Spectrograms
One way to "see" a sound is to create a spectrogram or sonogram of the digitized sound sample or waveform. A spectrogram typically shows time along the x-axis and frequency (pitch) along the y-axis and the amplitude is presented as a brightness in the plotted data. The brighter the colour the higher the amplitude. If you were ok at basic Mathematics at school you'll be able to understand a spectrogram.
Beamship Sound
Recently I've come across some attempts by two people to reproduce the famous (among the Meier-knowledgeable Ufologists that is) Beamship Sound.
You can listen to the original Beamship Sound right here:
<mp3>Beamship sounds.mp3</mp3>
Beamship Sound Spectrogram
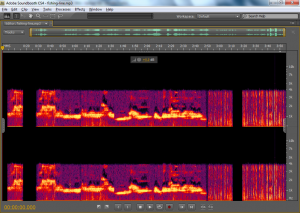
I've seen a spectrogram of the Beamship Sound before; Badr on the FIGU forum created one; however it wasn't a very clear graphic so I've reproduced it here using Adobe Soundbooth CS4:

If you examine the spectrogram above, which is only a 3-minute mp3-format ( 44Khz ) sample of the 20-minute full sample available from FIGU, then you can see that there are some obvious conclusions to make of it:
- There are multiple, simultaneous frequencies present at many time-points. For example at time-point 0:30 there are about 8 clear and distinct frequencies stacked above each other.
- The number of different frequencies changes frequently over time. For example, at time-point 0:30 there are 8 distinct frequencies but at 0:45 there are 4 or 5 then at 1:10 it drops to 3.
- The values of each of the frequencies are constantly increasing and decreasing in with time. The curliness of the horizontal lines on the spectrogram show this.
Now compare that to 2 recent efforts to duplicate the Beamship Sound below.
Beamship Sound Reproduction Attempts
Amplifier Feedback
Overview of guitar amplifier feedback
Some anonymous guy who calls himself Rorechof and Uzzz allegedly made this amplifier feedback effect with a guitar amp, tape recorder and a microphone:
<mediaplayer>http://www.youtube.com/watch?v=16L5TwUC_dY</mediaplayer>
Spectrogram of guitar amplifier feedback

A basic analysis shows clear differences in this sound sample to that of the Beamship Sound sample:
- The number of different frequencies changes infrequently over time. It has 5 or 6 visible and different frequencies present at most time-points.
- The values of each of the frequencies are not constantly increasing and decreasing in with time. The straightness of the horizontal lines on the spectrogram show this.
In fairness the creator of this amplifier feedback claimed that the variableness of the frequency values could be reproduced with a pitch shifter but I haven't seen this claim being tested yet and I do not have the required equipment so it's not possible for me to verify that theory.
Fishing line vibrations
Overview of fishing line vibration effect
A British man called Phil Langdon has attempted to duplicate the Beamship Sounds using a small model of a Wedding Cake UFO suspended on a fishing line that was tied between two trees. The vibrations of the wind against the hollow model caused a similar effect to the Beamship Sound we are familiar with but it was far too quiet (like the amplifier feedback) compared to the 3km audibility of the original sound effect. The 3km loudness of the sound was according to multiple witnesses who also never saw any equipment apart from 4 tape recorders and an audio suppression unit that Meier held in order to prevent distortions of the recorded sound because of the excessive decibels coming from the beamship 60 metres above his head.
<mediaplayer>http://www.youtube.com/watch?v=R_6ZXo0l5sk</mediaplayer>
Spectrogram of fishing line vibration effect

A basic analysis again shows clear differences in this sound sample to that of the Beamship Sound sample:
- The average number of different simultaneous frequencies present at any single point-in-time is 1. Not 4 or 5 or even 8, but just 1.
- The rate of change in the single visible frequency value is small. The frequency of the sound changes over time but it does not change frequently.
Final Conclusion
So far the Beamship Sounds have still not been duplicated by any Earthly means. There are similarities that are detectable by ear however when viewing the sound reproductions in the form of the spectrogram the differences become obvious and significant. The possibility that the original beamship sound originated from an actual and real beamship cannot be ruled out by any logical deduction. If it were easy to reproduce then what other possible reason is there that it hasn't yet been done?
James Moore
25th November 2010